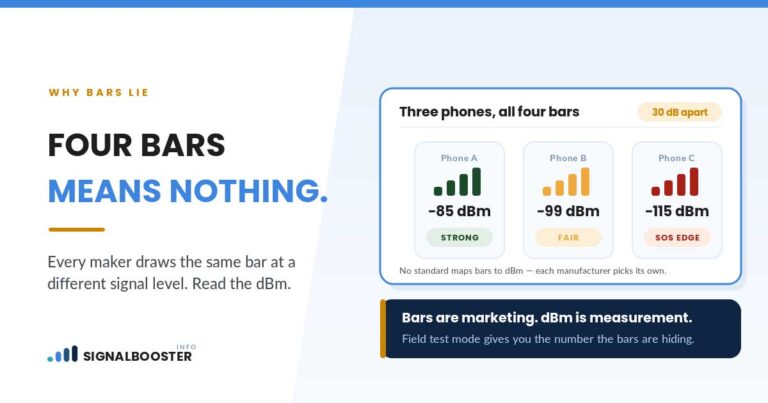
Two apps open at the same time, in the same spot, and they disagree. That is not a bug in either one. Most of the time the apps are not measuring the same thing: one may be reading raw signal power, another a quality figure, another a vendor’s own smoothed “percentage” that never touches a real radio value at all. They can also poll at different moments and pull from different levels of access to the phone’s radio hardware. When two readings conflict, the phone’s own built-in diagnostic screen (not a downloaded app) sits closest to the hardware and is the more trustworthy of the two. A single reading from either one is never enough to decide anything on its own.
They’re Not Broken: They’re Measuring Different Things
The instinct is to assume one app is wrong. Usually neither is. “Signal strength” is a label attached to several different radio measurements, and an app has to pick one (or invent its own composite) before it can show you anything at all.
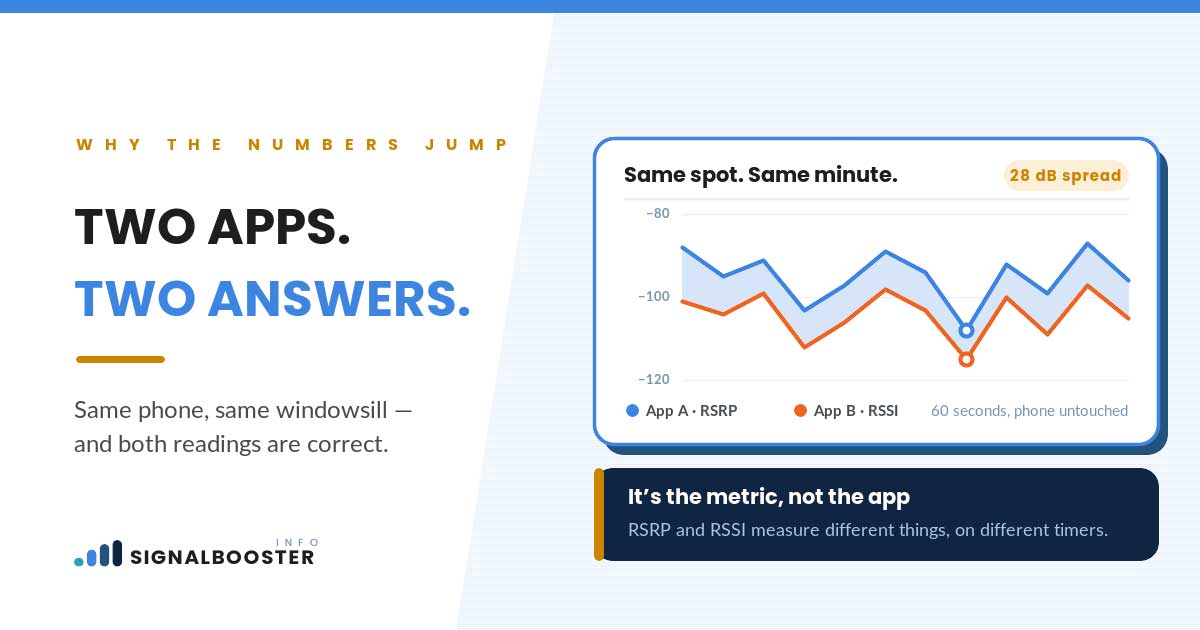
Some apps display RSSI, an older, broader measurement that lumps the wanted signal together with everything else arriving on the same frequency. Others display RSRP, a cleaner reading of just the reference signal power. A few show RSRQ or SINR, which describe how usable the signal is once interference is factored in, a genuinely different question from how much power is arriving. And some apps skip radio terminology entirely and show a “signal percentage” or star rating that is a proprietary blend nobody outside that company can audit.
None of these are lying. They are answering different questions with the same three words on the label.
Signal Strength Isn’t One Number
The deeper issue is that “signal strength” was never really one number to begin with. There is how much power is arriving (strength) and how usable that power is once noise and interference are stripped out (quality), and they can move independently of each other. An app that only reports one of the two is not wrong, it is incomplete, and comparing its single number against a different app’s single number, when the two happen to be reporting different halves of the picture, is where a lot of the “these don’t match” confusion actually comes from.
This site has a full breakdown of what each of these figures means and how they relate, in signal strength versus signal quality. If two apps disagree and you are not sure whether they are even measuring the same category of thing, that is the place to check before assuming either reading is broken.
Why the Phone’s Own Built-In Reading Is the More Trustworthy Source
Every smartphone has a diagnostic mode built by the manufacturer that reads directly from the modem, the same chip that is actually making the connection. On iPhone this is Field Test Mode. On Android it is a status or service-mode screen, reached differently depending on the manufacturer. Neither is an app you download. Both sit closer to the radio hardware than anything a third party can build on top of the operating system.
That proximity is the whole reason to prefer it. A third-party app has to ask the operating system for a number and accept whatever the OS is willing to hand over, which, as the next section covers, is not always the raw value. The built-in screen skips that layer. When a third-party app and the phone’s own diagnostic screen disagree, the built-in reading is the one to treat as the reference point, not because the app is faulty, but because it is one step further from the source.
Full instructions for finding this screen on both platforms are already covered in how to check your real dBm signal strength, and once you have a genuine dBm figure, what counts as a good dBm number explains how to read it.
How Averaging and Polling Intervals Change What You See
Signal strength is not a fixed value even when you stand still. It moves as the tower’s load changes, as nearby devices come and go, and as your phone quietly renegotiates its connection in the background. Two apps checking at slightly different moments, even a few seconds apart, can legitimately catch different numbers without either being wrong.
Some apps report close to real time, refreshing with almost every change the modem reports. Others average readings over a short window before displaying anything, which produces a smoother, more stable-looking number that lags behind what is actually happening right now. Neither approach is more “correct,” they are simply optimized for different things: a live troubleshooting tool wants the raw, jumpy number, while a general-purpose network app wants something that does not flicker every second.
This is also the practical reason a single reading, from any app, is a bad basis for a decision. If you are trying to establish what your signal genuinely is in a given spot, take several readings, a few minutes apart, rather than trusting whichever number happened to be on screen the moment you looked.
What Third-Party Apps Can and Can’t Actually Access
Phone operating systems do not hand every app full access to modem data. What a third-party signal-meter app can display is bounded by what the operating system’s public interface exposes to outside developers, and that boundary is tighter on some platforms than others.
The practical result: a downloaded app might only have access to a rounded or bucketed value, a category like “good/fair/poor” translated from an underlying number it never actually sees precisely, or a value that updates less often than the modem’s own internal readings do. This is not a flaw specific to any one app, it is a structural limit that applies to the whole category, which is part of why the built-in diagnostic screen (with its direct hardware access) tends to read differently, and more precisely, than anything installed afterward.
None of this makes third-party apps useless. They are often easier to read at a glance and can be genuinely convenient for a quick check. It just means their number should be treated as a convenience reading, not the final word, when it disagrees with the phone’s own diagnostic screen.
Carrier Aggregation: Why One Reading Can Represent Several Signals at Once
There is a further wrinkle that trips up even careful readers. Modern networks routinely combine more than one radio signal into a single connection, a technique called carrier aggregation, where a phone links to a primary cell and one or more secondary cells at the same time to increase throughput.
When that is happening, “your signal strength” is not one measurement anymore, it is a combination, and different apps make different choices about what to display: some show only the primary serving cell, some attempt to show an aggregate figure, and some occasionally surface a neighboring cell’s reading (data the phone is also collecting in the background to prepare for a handoff) rather than the cell you are actually connected to right now. Two apps that are each technically reporting something real can end up showing numbers that describe two different parts of the same connection.
This is one reason a like-for-like comparison matters more than people expect: compare the same metric, from the same category of source, ideally at close to the same moment, before concluding that one reading is simply wrong.
Which Reading to Trust When You Need to Make a Decision
When the numbers disagree and you actually need to act on one of them, a short hierarchy resolves most cases.
| Situation | What to trust | Why |
|---|---|---|
| Built-in diagnostic screen vs. a downloaded app | The built-in screen | Reads closer to the modem hardware; the app is limited by what the OS exposes |
| Two different apps disagreeing | Neither, until you check what each one measures | They may be reporting different metrics (strength vs. quality) or different cells |
| One reading vs. several readings over time | The average of several readings | Signal moves constantly; a single snapshot is not representative |
| A “percentage” or star rating vs. a dBm figure | The dBm figure | Percentages and stars are often a vendor’s own composite, not a standard radio measurement |
The pattern underneath all four rows is the same: prefer the source that is closer to the hardware, prefer a real radio unit over a normalized score, and prefer several readings over one. A single number from a single app, taken once, is the least reliable version of this information you can get, regardless of which app produced it.
If your goal is deciding whether a fix like a signal booster would actually help, that decision should rest on the dBm reading from your phone’s own diagnostic screen, taken more than once, in the spot where the problem actually happens, not on whichever app’s number looked worst.
FAQ
Why do two signal apps show different dBm numbers in the same spot?
They are often not reading the same thing. One may show RSSI, another RSRP, another a proprietary blended score. Add a few seconds of timing difference and normal signal fluctuation, and disagreement is the expected outcome, not a malfunction.
Which signal reading should I trust, my phone’s settings or a downloaded app?
The phone’s own built-in diagnostic screen (Field Test Mode on iPhone, a status or service menu on Android) reads closer to the modem hardware. Treat it as the reference point when it disagrees with a third-party app.
Is a “signal percentage” the same as dBm?
Usually not. A percentage or star rating is frequently a vendor’s own conversion from an underlying value, and different vendors convert differently. A genuine dBm reading is a standard radio measurement; a percentage is not.
Should I trust a single reading from any app?
No. Signal strength fluctuates continuously with tower load and normal network activity. Take several readings a few minutes apart in the same location before treating any single number as accurate.
Can two apps both be “right” and still show different numbers?
Yes. If one is reporting the primary connected cell and another is capturing a neighboring cell the phone is also monitoring for a future handoff, both readings can be genuine and still describe different things.