Signal bars are a vendor-defined graphic, not a unit of measurement. No industry standard, carrier requirement, or FCC rule specifies what one bar means. Each handset maker (and in some cases each carrier’s software build) decides how received signal maps to how many bars appear, how many bars the display has in total, and how quickly the display responds to change. Two phones on the same carrier, sitting on the same table, receiving identical signal, can legitimately show different bar counts. The number underneath, the received power in dBm, is a real measurement and reads consistently across handsets. That gap between the picture and the measurement is the reason this page exists.
What Bars Are Actually Doing
The bar display has one job: give a person a rough, instant sense of whether their phone is likely to work. It is user-interface design, and by that standard it is quite good. Five little bars communicate more in a glance than a negative number in decibels ever will.
The problem starts when people use a reassurance graphic as an instrument. Once you are trying to answer questions like “is this room worse than that room,” “did the antenna I just installed help,” or “do I have enough signal to justify spending money,” the bars stop being useful and start being actively misleading.
Three specific reasons why.
1. Nobody standardized the scale
There is no specification that defines a bar. The mapping from received signal to bars is chosen by the vendor. That means:
- The number of bars on the display varies by phone and by software version.
- The signal level that triggers the jump from two bars to three is a design choice, not a physical threshold.
- The mapping can change on your own phone with a software update, without any announcement, and without anything having changed on the network.
The practical consequence: bars are not comparable between two different phones, and they are not reliably comparable on the same phone across a major update. Comparing your bars against your spouse’s bars proves nothing at all about the two devices or the network.
2. Bars usually reflect one number, and your experience depends on several
On modern networks, the signal your phone reports is not a single figure. Received power (how much of the tower’s reference signal arrives) is one measurement. Quality (how clean that signal is once interference and noise are accounted for) is a different one. Both matter, and they can move independently.
The bar display is generally driven by received power. That means a room full of strong but badly polluted signal, or a tower carrying more users than it has capacity for, can produce a confident full-bar display attached to a connection that fails in practice. This is the single most common complaint in this whole subject area, and it has its own page here: full bars but calls dropping. The companion explanation of the two measurements is in signal strength versus signal quality.
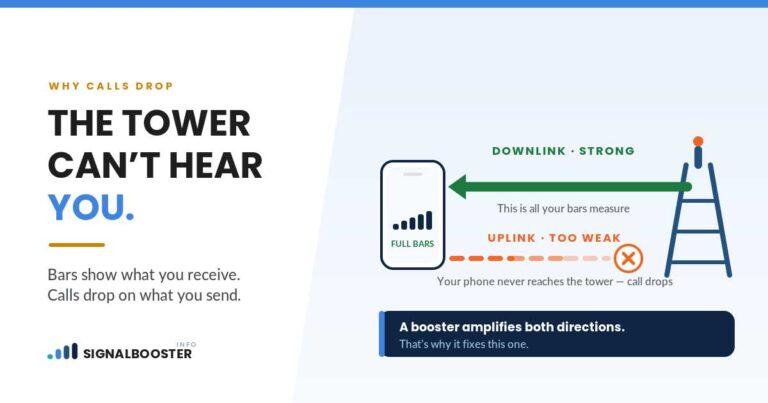
3. Bars show the downlink. Your call needs the uplink too
Your phone measures what arrives from the tower. It has no way to display how well the tower is hearing your phone.
The two directions are not symmetrical. The tower has height, size, and mains power behind its transmitter. Your phone has a battery. A situation where you can hear the network perfectly and the network cannot hear you is entirely normal, and it produces one-way audio, calls that drop when you start talking, and uploads that stall while downloads run fine. No bar display will ever warn you about it, because the information is not on your side of the link.
The Test That Proves It in Two Minutes
You do not have to take this on faith, and this is the part no ranking page asks you to do.
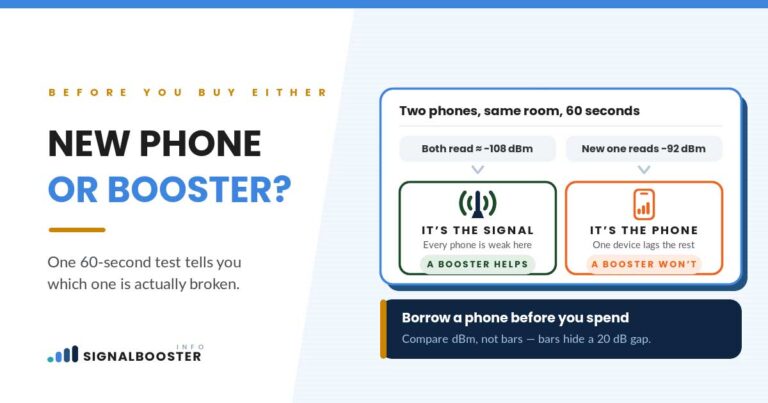
- Put two phones on the same carrier next to each other, on the same surface, not being held.
- Note the bar count on each.
- Open the built-in signal readout on each and note the dBm figure.
What people generally find: the dBm figures land close together, because both handsets are measuring the same physical thing with similar radios. The bar counts often differ, sometimes by two, because each vendor drew its own scale. If you only have one phone, do the same test in one spot before and after a major software update, or compare an older handset against a new one.
That is the whole argument, demonstrated on your own kitchen table with no equipment.
What to Use Instead
The measurement is already in your phone. It is not an app, not a download, and not a paid tool. Both major platforms expose the received signal in dBm through their own settings or diagnostic screens, and how to check your real dBm signal strength walks through where to find it on each.
Once you have a number, interpreting it is a separate skill, and the numbers deserve their own page rather than a paragraph here: what counts as a good dBm signal strength covers the scale, including the counterintuitive part (the numbers are negative, and closer to zero is stronger).
Two cautions that keep people honest with their own data:
- Read the same spot more than once. Signal moves. A single reading taken while walking through a doorway is not a measurement of the room.
- Third-party apps do not all report the same thing. Different apps read different underlying values, round differently, and update at different rates, which is why two apps on one phone can disagree. That is explained in why signal strength readings differ between apps. The phone’s own built-in readout is the reference point.
Where Bars Still Earn Their Place
An honest page concedes something, and here is the concession: bars are fine for what they were designed for.
They are a quick glance. They tell you, roughly, whether to expect a call to work in the next thirty seconds. For a person who is not diagnosing anything and not about to spend money, that is enough, and asking everyone to read decibels would be absurd.
Bars stop being adequate at exactly one moment: when you begin comparing. Comparing rooms, comparing floors, comparing before and after an install, comparing carriers, comparing your house against a neighbor’s. Every one of those is a comparison, and a scale that each vendor draws for itself cannot support comparison. That is the boundary, and it is worth stating plainly rather than pretending bars are useless.
Why This Matters Before You Spend Money
The reason this site keeps returning to dBm is not pedantry. It is that a purchase decision made on bars is a decision made on a graphic.
Sizing an installation, judging whether there is a usable outdoor signal to capture, and proving an install actually worked all require a number that means the same thing twice. Coverage claims measured in square feet are only meaningful against a starting signal level, which is why our page on how much coverage a signal booster really gives you starts from the outdoor reading rather than from the number printed on the box.
If you do nothing else with this page: take one dBm reading outside your building and one in the worst room, and write both down with the date. That pair of numbers is worth more than every bar display you will look at this year.
FAQ
Are cell phone signal bars accurate?
Not as a measurement. There is no standard defining what a bar represents, so each manufacturer sets its own mapping from received signal to bar count. Bars are a rough visual indicator, useful for a quick glance and unreliable for any comparison.
Why do two phones on the same carrier show different bars in the same place?
Because each vendor chooses its own scale and its own thresholds. The underlying received power measured by both handsets is generally similar, but the number of bars drawn from that measurement is a design decision that differs between phones and software versions.
What is the real way to measure cell signal strength?
The received power figure in dBm, available in the phone’s own settings or diagnostic screens on both major platforms. It is a genuine measurement and reads consistently across devices, which makes it the only sound basis for comparing locations or judging an installation.
Why do I have full bars but calls still drop?
Bars generally reflect how much signal is arriving from the tower, not how clean that signal is, and not how well the tower is receiving your phone. Poor signal quality, network congestion, or a weak uplink can all break a call while the display still shows full strength.
Do signal strength apps give better readings than the bars?
They give numbers rather than a graphic, which is an improvement, but different apps read different underlying values and can disagree with each other on the same phone. Your phone’s own built-in signal readout is the reference to trust.