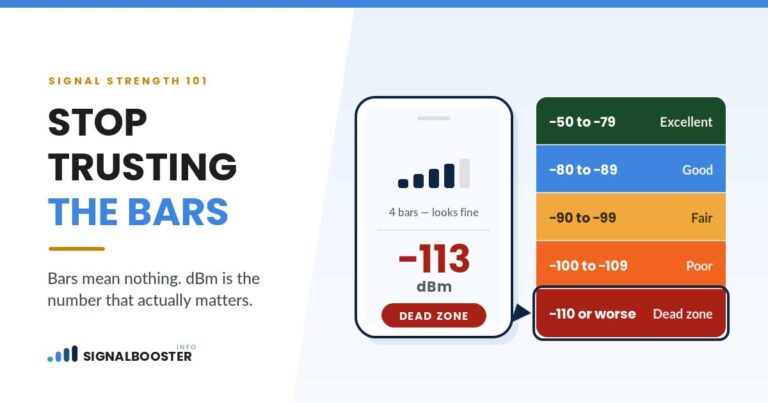
If you have already pulled a dBm reading off your phone, the number in front of you is probably somewhere between -70 and -120, and it means nothing until you have something to compare it against. The short version: anything stronger than about -90 dBm is comfortable, the -90s and low -100s are where indoor rooms start to struggle, and below about -115 dBm you are effectively in a dead zone. But that summary hides two things worth knowing before you make a decision based on it, and this article is mostly about those two things.
If you do not have a number yet, start with how to check your real signal strength in dBm and come back. Reading the scale without a reading of your own is an academic exercise.
The Band Table (and Where It Comes From)
Here is a published reference set for RSRP, the reference-signal received power figure your phone reports on 4G LTE and 5G. These ranges come from Powerful Signal’s knowledge base entry on signal strength and quality, which is cited here because it publishes explicit boundaries rather than a vague gradient.
| RSRP reading | Rating | What you tend to notice |
|---|---|---|
| -89 dBm or stronger | Excellent | Calls connect immediately, data is fast, hardware will add little |
| -90 to -104 dBm | Good | Fine in most of the house, weaker rooms may lag |
| -105 to -114 dBm | Fair | Slow data, occasional dropped calls, interior rooms are difficult |
| -115 to -124 dBm | Poor | Calls fail, data is barely usable |
| -125 dBm or weaker | No usable signal | The phone may show “SOS Only” or “No Service” |
Two features of this scale trip people up. First, the numbers are negative, so -89 is stronger than -105. Closer to zero is always better. Second, the scale is logarithmic, which means the gap between -95 and -105 is not a small nudge. A ten-decibel difference is a large change in received power, not a rounding error, and that is why a reading that moves by ten points after you change something is a genuine result rather than noise.
Why Two Sources Give You Two Different Answers
Search this question and you will find one site putting the trouble threshold at -85 dBm, another at -100, and a third at -110. They are not all wrong, and the disagreement is not sloppiness. There are three real reasons for it.
These are conventions, not standards. No regulator publishes an official “good signal” boundary. Every table you find is a vendor or publisher drawing lines on a continuous scale where they judge the reader’s experience changes. Reasonable people draw them in different places.
Different metrics get labelled with the same word. Older tables were built around RSSI, which measures total received power across a channel including interference and noise from neighboring cells. RSRP measures the power of the reference signal alone. The two report different numbers for the same physical conditions, and RSSI figures are typically less negative. A table inherited from the RSSI era and relabelled “signal strength” will look stricter than one built on RSRP.
Network generation shifts the thresholds slightly. The direction never changes (closer to zero is better on every technology), but where “fair” becomes “poor” is not identical across 4G LTE and the various 5G deployments. Treat any single boundary as approximate.
The practical consequence: do not obsess over whether your reading falls one point either side of a line. A reading of -104 and a reading of -106 describe the same situation, whatever two different tables call them.
What the Number Actually Decides
A grade is not useful on its own. What you want is which of three actions your reading points to, and the honest mapping is simpler than most articles make it.
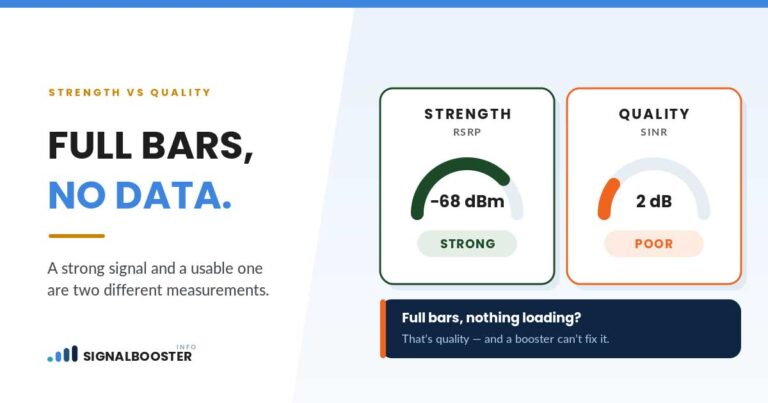
Stronger than about -95 dBm, and service is bad anyway. Your strength is not the problem. Something else is, and amplifying a signal you already have will not address it. This is the case that sends you to signal strength vs signal quality, because the explanation is almost always sitting in your quality numbers rather than your strength number.
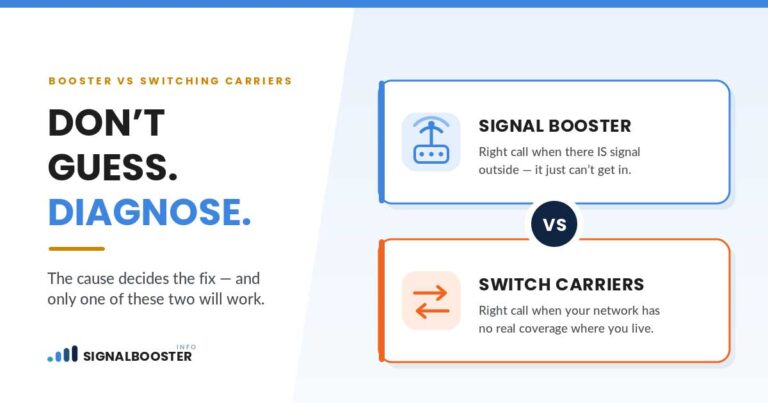
Between roughly -95 and -115 dBm. This is the band where a usable outdoor signal exists and the building is what stands between you and it. It is also the band where an outdoor antenna and amplifier is the category of fix that applies, because there is something outside worth bringing in. Before spending anything, work through why your signal is weak at home to identify what is actually attenuating it, and read what coverage claims really mean in square feet, so you are not judging hardware by a box specification.
Weaker than about -115 dBm everywhere, including outdoors. This is the hardest honest conversation in this niche. Amplification needs an input. If there is nothing usable outside your house either, a booster has very little to work with, and the realistic options are a different carrier, a Wi-Fi-based calling path, or accepting the limitation. This site has no affiliate links and no reason to pretend otherwise, which is the whole point of our editorial policy.
Notice that only one of those three cases points toward hardware. That is not pessimism, it is the actual distribution.
When a “Good” Number Still Means Bad Service
This is the scenario that generates the most frustrated searches, and the dBm scale genuinely cannot explain it. A strong RSRP tells you the tower’s signal is arriving with plenty of power. It says nothing about three other things.
Interference. If a competing signal or background noise arrives alongside the one you want, your phone has to pick the useful part out of the mess. Strong and noisy performs worse than moderate and clean.
Congestion. Signal power and tower capacity are unrelated. A tower can be delivering a textbook -75 dBm to your window and still be oversubscribed at six in the evening, when everyone in the neighborhood is home and streaming. Nothing about that is visible in a dBm reading, and no amplifier changes it.
Which band you are on. A -95 dBm reading on a low-frequency band that travels well through walls will usually feel better indoors than an identical -95 dBm on a high-frequency band that loses ground quickly through the first obstruction. Same number, different experience.
If your reading looks fine and your service does not, those three are where the answer lives.
Take More Than One Reading Before You Judge It
A single dBm value is a snapshot of one spot, at one moment, facing one direction. Signal fluctuates on its own, and people routinely draw conclusions from a reading taken while standing in the one bad corner of a room.
Before you act on a number, do this much:
- Take readings in at least three fixed spots, including the worst room and one you actually use most.
- Take each one twice, at different times of day, ideally a day or two apart.
- Take one reading standing outside the building. This is the single most informative one, because the difference between your outdoor and indoor readings is the measure of what the building is costing you.
- Write them down with the date and the location. Memory is not a log.
That outdoor-versus-indoor gap is worth more than any single number. A house reading -110 dBm inside and -80 dBm outside has a building problem with an obvious category of fix. A house reading -110 inside and -108 outside has a coverage problem, and that is a different conversation entirely.
FAQ
What is a good dBm signal strength?
Using the RSRP ranges cited above, -89 dBm or stronger is excellent, -90 to -104 dBm is good, -105 to -114 dBm is fair, and -115 dBm or weaker is poor. These are published conventions rather than an official standard, so treat the boundaries as approximate.
Is -100 dBm good or bad?
It sits in the “good” band on the scale above, but it is close to the edge. Outdoors and near windows it will usually be fine; interior rooms, basements and the far side of the house will often be noticeably worse.
Why is my dBm number negative?
Because the scale expresses power relative to one milliwatt on a logarithmic scale, and the signals a phone receives are a tiny fraction of a milliwatt. A negative value is normal and expected. Only the distance from zero matters.
Does the same scale apply to 5G?
The direction does: closer to zero is better on every network type. The exact boundaries shift slightly between 4G LTE and 5G deployments, so use the table as a guide rather than a precise cutoff.
My number looks fine but my calls still drop. What now?
Then strength is not your limiting factor. Read signal strength vs signal quality, which covers the interference and congestion measurements that a dBm reading cannot show you.